
The working capital ratio compares a business's current assets with its current liabilities to show whether short-term assets can cover the bills due in the next 12 months. You find it by dividing current assets by current liabilities, and it is the same number accountants call the current ratio.
The formula is simple; reading it is where owners get stuck. As a business funding broker, we look at the ratio from the side of the owner who might borrow. This guide covers the formula, a worked example, what counts as a good ratio, how different kinds of debt move the number and how to improve a low one.
What Is the Working Capital Ratio?
The working capital ratio compares what a business owns that will turn into cash within a year with what it owes within a year. Divide current assets by current liabilities. A result above 1 means short-term assets cover short-term debts; below 1 means they don't. It's also called the current ratio.
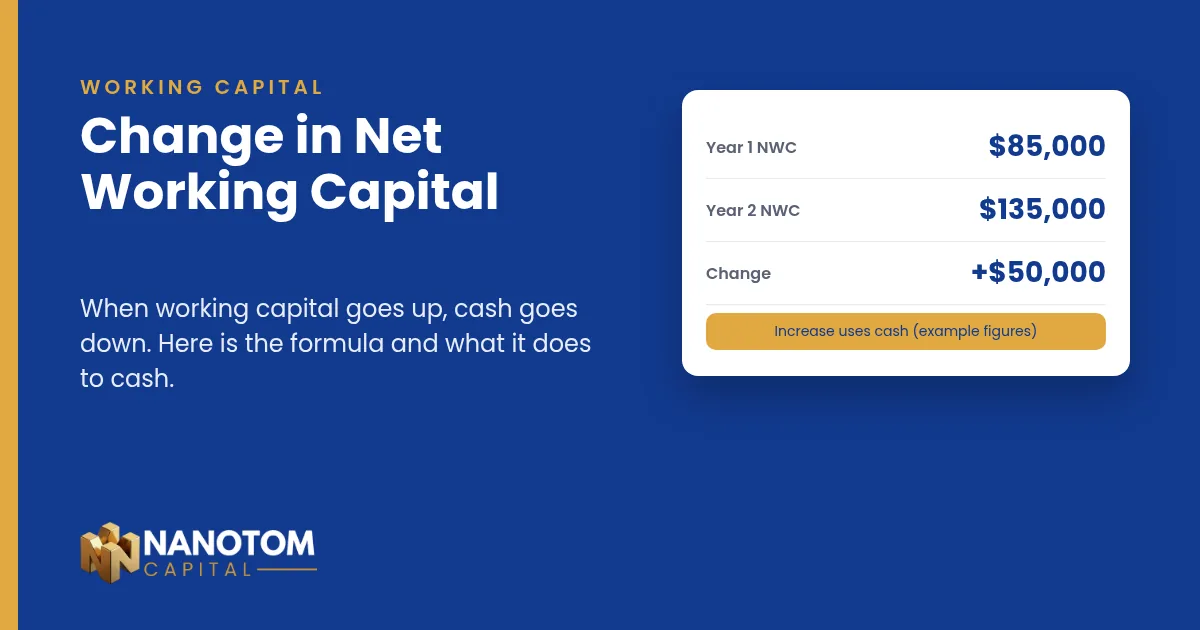
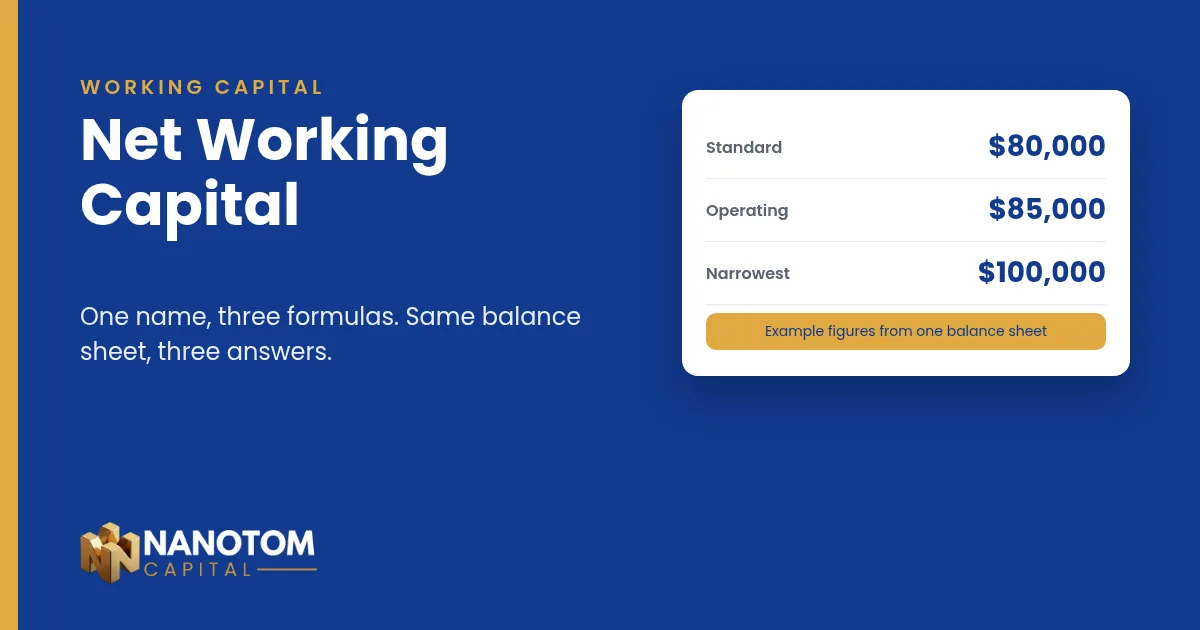
It's a ratio, not a dollar amount. Working capital itself is current assets minus current liabilities, while the ratio divides the same two numbers. If you need the basics first, start with what working capital is, then see how working capital financing fits when the cushion runs thin.
Working Capital Ratio Formula
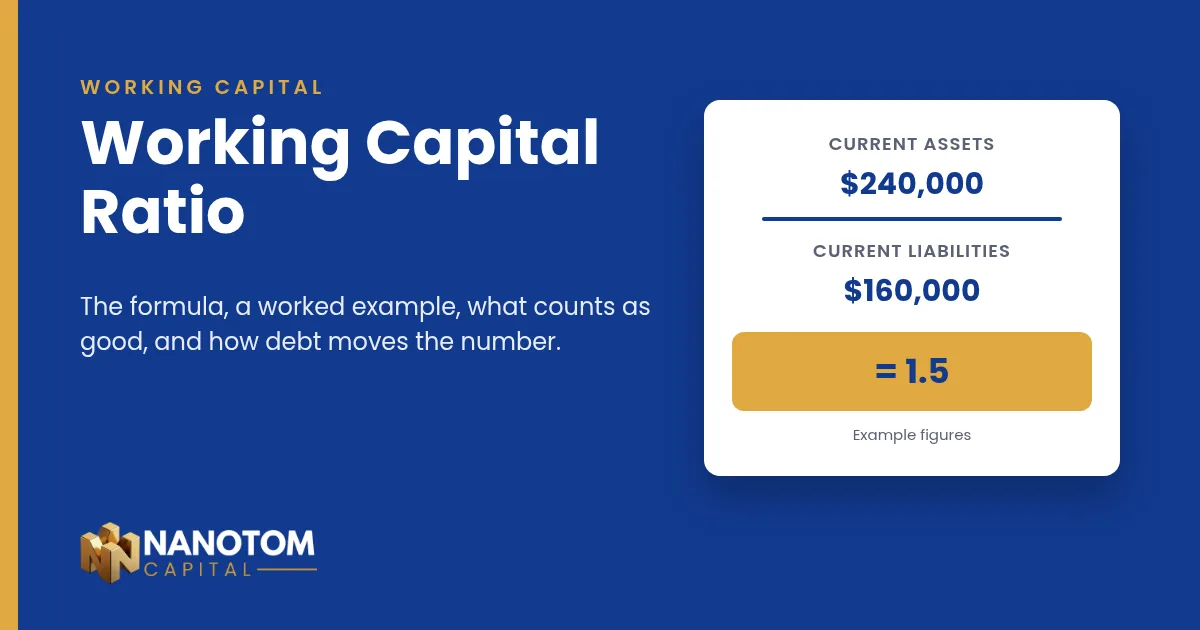
Working capital ratio = Current assets ÷ Current liabilities
Both numbers come from the same balance sheet, on the same date.
Current assets are things you expect to turn into cash within 12 months:
- Cash and cash equivalents
- Accounts receivable (what customers owe you)
- Inventory
- Prepaid expenses
Current liabilities are what you owe within 12 months:
- Accounts payable (what you owe suppliers)
- The part of any loan due in the next 12 months
- Accrued payroll and taxes
- Credit card balances and other short-term debt
How to Calculate the Working Capital Ratio
- Add up your current assets from the balance sheet.
- Add up your current liabilities from the same balance sheet.
- Divide the first total by the second. Round to two decimals.
Here's a hypothetical business to show the math. The figures are made up for illustration.
| Current assets | Amount | Current liabilities | Amount |
|---|---|---|---|
| Cash | $60,000 | Accounts payable | $70,000 |
| Accounts receivable | $90,000 | Loan payments due within 12 months | $50,000 |
| Inventory | $80,000 | Accrued payroll and taxes | $25,000 |
| Prepaid expenses | $10,000 | Credit card balances | $15,000 |
| Total | $240,000 | Total | $160,000 |
$240,000 ÷ $160,000 = 1.5
This business has $1.50 in current assets for every $1.00 it owes in the next year. Its working capital, the dollar figure, is $240,000 minus $160,000, or $80,000.
What Is a Good Working Capital Ratio?
There's no official standard, and published guides don't agree. One UK lender's guide calls 1.2 to 2.0 generally good (iwoca). Two US sources put the healthy range at 1.5 to 2.0 (OnDeck, Xero). Lenders set their own thresholds, and requirements vary by lender. What the guides do agree on is how to read each zone:
| Ratio | What it usually means |
|---|---|
| Below 1.0 | Current liabilities are bigger than current assets. Paying bills on time may depend on new cash coming in. |
| 1.0 to about 1.2 | You can cover what's due, with little room for a slow-paying customer or a surprise cost. |
| About 1.2 to 2.0 | The range most guides call healthy. Enough cushion without much idle money. |
| Above 2.0 | Comfortable, but cash or inventory may be sitting idle instead of working for the business. |
What does a working capital ratio of 2:1 mean?
A 2:1 ratio, or 2.0, means you have $2 of current assets for every $1 of current liabilities. That's a strong cushion. Whether it's too much depends on why it's high. Cash you're saving for a planned purchase is one thing. Inventory that isn't selling is another.
Working Capital Ratio vs. Working Capital vs. Quick Ratio
These measure related things, and they're easy to mix up. Using the example business above:
| Measure | Formula | Example result | What it tells you |
|---|---|---|---|
| Working capital | Current assets minus current liabilities | $80,000 | The dollar cushion |
| Working capital ratio (current ratio) | Current assets ÷ current liabilities | 1.5 | The cushion relative to what you owe |
| Quick ratio | (Cash + receivables) ÷ current liabilities | 0.94 | Coverage without counting inventory |
| Cash ratio | Cash ÷ current liabilities | 0.38 | Coverage from cash alone |
The quick ratio leaves out inventory because stock can take months to sell. In the example, a healthy-looking 1.5 drops below 1 once inventory is removed. That's worth knowing if your stock moves slowly. For the dollar figure and more examples, see our guide to the working capital formula.
Why "Good" Depends on Your Industry
A single benchmark doesn't fit every business. A retailer carrying a lot of stock tends to have more current assets than a service business with no inventory.
A business that's paid on the spot needs less cushion than one waiting 60 days on invoices. Seasonal businesses can swing widely through the year, so a ratio taken in the slow season and one taken at the peak can tell two different stories.
The most useful comparison is with businesses like yours. Your accountant or lender may have industry figures. Industry associations often publish them, and ProSight Statement Studies (formerly RMA Annual Statement Studies) sells benchmark ratios by industry, built from financial statements that lenders collect from their borrowers (ProSight).
How Borrowing Changes Your Working Capital Ratio
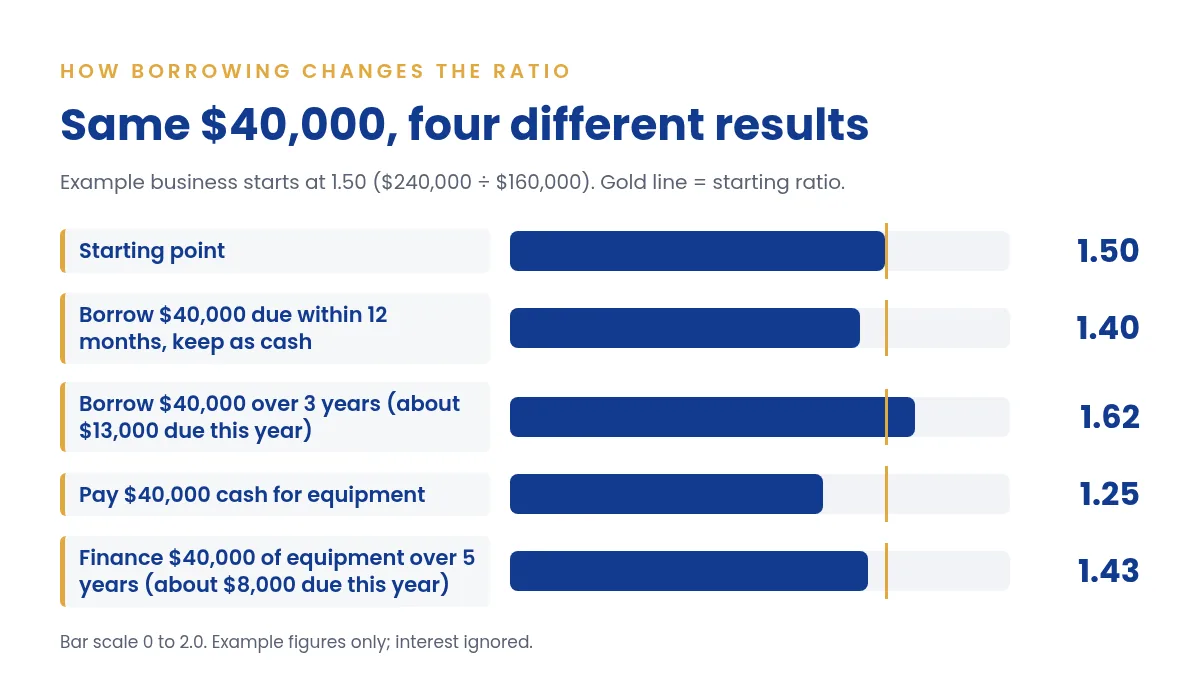
This is where owners get surprised. The type of financing you use moves the ratio in different directions, even when the amount is the same. Starting from the example business at 1.5, here's what $40,000 does in four simplified scenarios. The figures are an example only and ignore interest.
| What happens | Current assets | Current liabilities | New ratio |
|---|---|---|---|
| Borrow $40,000 due within 12 months, keep it as cash | $280,000 | $200,000 | 1.40 |
| Borrow $40,000 over 3 years, about $13,000 due in the next 12 months | $280,000 | $173,000 | 1.62 |
| Pay $40,000 cash for equipment | $200,000 | $160,000 | 1.25 |
| Finance $40,000 of equipment over 5 years, about $8,000 due in the next 12 months | $240,000 | $168,000 | 1.43 |
Three takeaways:
- Short-term debt pulls the ratio toward 1, because it adds to both sides at once.
- Longer-term debt only counts the next 12 months of payments as current, so the ratio can rise.
- Paying cash for long-lived assets lowers the ratio more than financing them does.
None of this makes borrowing right or wrong. It's about matching the financing to the need: short-term money for short-term gaps, longer terms for assets you'll use for years.
Lenders may look at your liquidity alongside revenue, credit and cash flow, and some loan agreements set a minimum current ratio you have to keep. Requirements vary by lender, so ask before you sign whether the agreement includes one.
How to Improve Your Working Capital Ratio
- Collect faster. Invoice promptly, follow up on overdue accounts and consider small discounts for early payment.
- Pay suppliers on agreed terms, not early. Ask whether longer terms are possible, without damaging the relationship.
- Trim slow inventory. Stock that doesn't sell ties up cash and flatters the ratio.
- Refinance short-term debt into a longer term if a large balance is due within the year.
- Keep more profit in the business instead of drawing it all out.
- Avoid paying cash for long-lived assets when financing them fits your budget better.
Pick one or two to start. Collections and inventory usually move the number fastest, because they turn assets you already have into cash.
Limitations of the Working Capital Ratio
- It's a snapshot. It reflects one day on the balance sheet. Check it monthly to spot trends.
- It doesn't judge quality. Old receivables or stale inventory count the same as cash.
- It ignores timing within the year. A big bill due next week and one due in 11 months count the same.
- It isn't profitability. A business can have a strong ratio and still lose money.
When Outside Financing Makes Sense
If your ratio is low because cash is stuck in receivables or inventory, financing can bridge the gap while you fix the cause. Common options include:
- A business line of credit for recurring, uneven needs, where you draw only what you use
- Receivables financing to turn unpaid invoices into cash
- Short-term working capital products. Some, like a merchant cash advance, are priced with a factor rate rather than an APR, so compare the total repayment amount carefully (a cash advance calculator shows it next to an estimated APR)
Our guide to working capital loans for small businesses compares these options side by side, including how each one shows up on the balance sheet.
Nanotom Capital is a business funding broker; we're not the lender.
Working Capital Ratio FAQs
Is the working capital ratio the same as the current ratio?
Yes. Both divide current assets by current liabilities. "Current ratio" is the usual accounting term.
Can the working capital ratio be negative?
Not if you're dividing positive numbers. What people mean by "negative" is negative working capital, the dollar figure, which shows up as a ratio below 1.
What is a working capital ratio of 1.5?
It means $1.50 of current assets for every $1.00 due within a year. Most guides treat that as healthy.
Is a high working capital ratio bad?
Not necessarily. A high ratio is safe, but if it comes from idle cash or slow-moving inventory, that money may be better used in the business.
Do lenders only look at the working capital ratio?
No. It is one sign of liquidity among several, and requirements vary by lender. As Denis Brandao, Founder & CEO of Nanotom Capital, puts it: "Your credit score is only part of the story. Revenue and time in business matter just as much."
How often should I calculate it?
Monthly works for most small businesses. It lets you see trends and seasonal swings before they turn into problems.